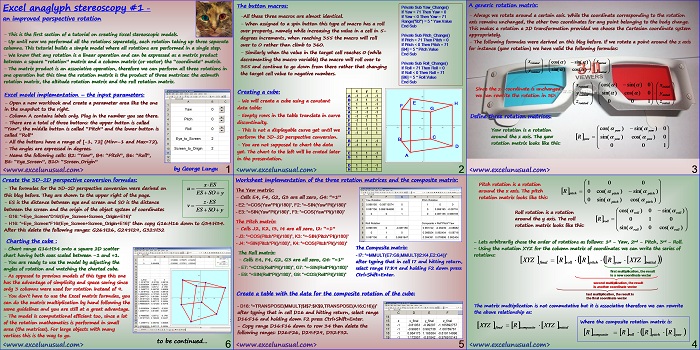
I made a stereoscopic model in October last year, however, choosing the wrong colors (red and blue on a black background, the effect was very weak (if any). This series was suggested to me last week by one of the guests here on the website, Don L. (thanks Don!), who sent me his stereoscopic cube. I opened the model, put on my goggles and his cube literally popped out of the screen. I realized that white (which I always avoided) is a a good background, which combined with a red object and another a light blue offset object all make a nice setup for stereoscopic imaging. The red can be almost anything (orange, yellow and even green). Now I quote from Wikipedia: “Stereoscopy (also called stereoscopic or 3-D imaging) refers to a technique for creating or enhancing the illusion of depth in an image by presenting two offset images separately to the left and right eye of the viewer. Both of these 2-D offset images are then combined in the brain to give the perception of 3-D depth. Three strategies have been used to accomplish this: have the viewer wear eyeglasses to combine separate images from two offset sources, have the viewer wear eyeglasses to filter offset images from a single source separated to each eye, or have the lightsource split the images directionally into the viewer’s eyes (no glasses required).” This part of the tutorial introduces the reader to a more efficient implementation of the composite object rotation in a 3D Cartesian space.
![]()
![]()
↧
Introduction to Anaglyph Stereoscopy in Excel – part #1: a more efficient composite rotation in the 3D Cartesian space
↧
